On Wednesday, the EUR/USD currency pair continued to trade very calmly, as the market lacked significant fundamental and macroeconomic indicators, with only a few minor events taking place. Market participants are currently in a wait-and-see mode for several reasons. In essence, there is something to anticipate.
First, sanctions against Mexico and Canada are set to take effect at the beginning of next month. Second, on March 12, new tariffs on aluminum and steel imports to the U.S. will be implemented. Third, in February, additional tariffs on imports from the European Union may be announced. Furthermore, the first week of each month traditionally brings updates on U.S. labor market and unemployment data.
While the first three factors primarily pertain to U.S. foreign policy, they could provoke reactions from market participants. Unfortunately, it is difficult to predict how the market will respond to these geopolitical developments. Although any tariffs or sanctions will have economic consequences, the specific nature and extent of these impacts remain uncertain. Additionally, when one country imposes sanctions, the targeted country may retaliate. The EU could respond to Washington with either strict measures or a more moderate approach—one that allows it to appear firm without completely conceding to Donald Trump.
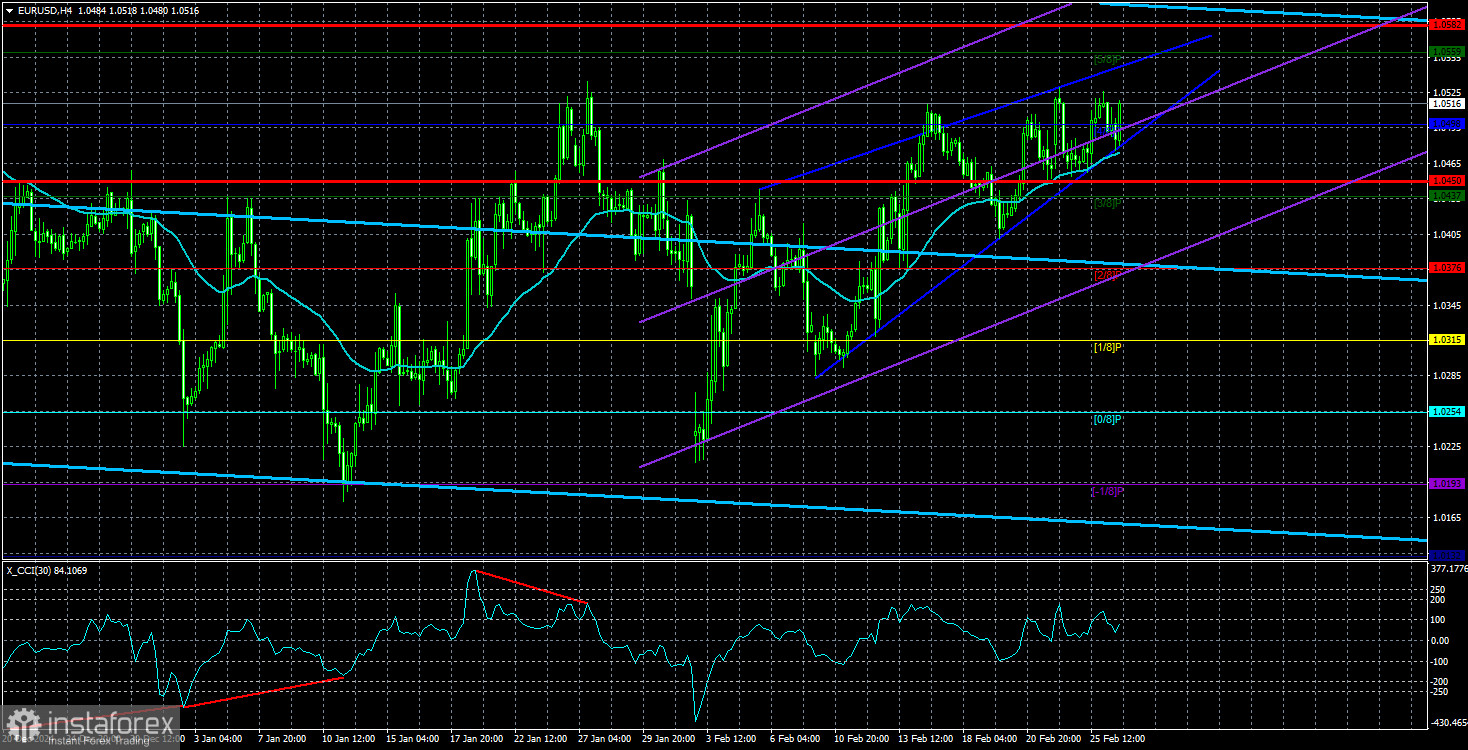
As a result, there is more uncertainty in the market than clarity. The euro remains in a sideways range on the daily timeframe, which perfectly complements the overall market situation. We have also added a "narrowing triangle" pattern to our analysis, which, in our view, could be a precursor to a new decline in the euro. Consider this: the pair is near the upper boundary of the sideways channel, has failed to break through for over a week, market volumes are low, and there is no fundamental or macroeconomic support. The pair's future movement can only be determined by technical factors. And technically, we see a range-bound market and a "narrowing triangle."
We have long expected the euro to decline, and after the past six weeks, it is clear that the currency has barely managed to correct against its three-month downtrend. The correction could last several months, slowly pushing the euro to the fifth or sixth resistance level. However, the overall picture remains unchanged—the euro has no long-term growth factors.
US macroeconomic data at the beginning of next month might trigger a decline in the dollar. However, predicting non-farm payrolls and unemployment rate reports in advance is impossible. If these reports are weak, the pair may rise. Under current circumstances, we still anticipate a new decline in the euro. However, we need confirmation signals, such as a breakout below the "triangle" pattern.
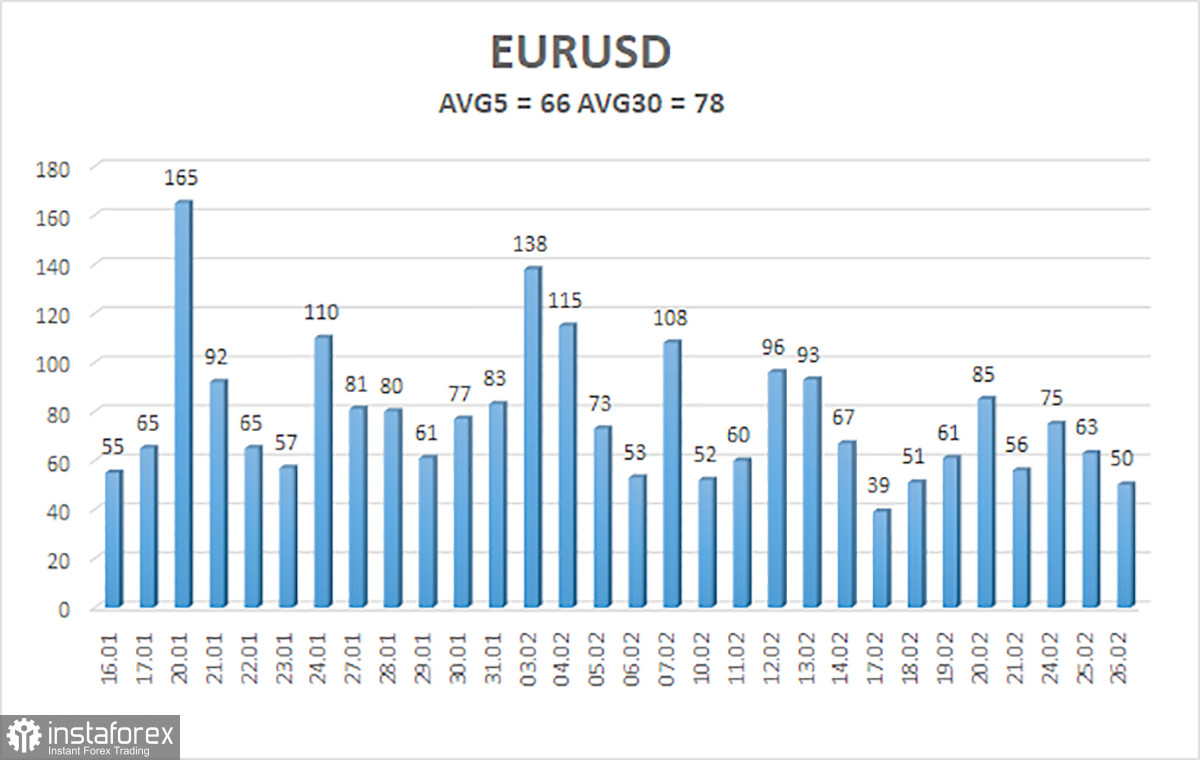
As of February 27, the average volatility of the EUR/USD pair over the last five trading days stands at 66 pips, classifying it as "moderate." We expect the pair to move between 1.0450 and 1.0582 on Thursday. The long-term regression channel remains downward, maintaining the global downtrend. The CCI indicator last entered the oversold area, triggering a new rise from the bottom.
Nearest Support Levels:
S1 – 1.0498
S2 – 1.0437
S3 – 1.0376
Nearest Resistance Levels:
R1 – 1.0559
R2 – 1.0620
R3 – 1.0681
Trading Recommendations:
The EUR/USD pair continues its upward correction. For months, we have maintained that we expect only a decline in the euro in the medium term, and this view remains unchanged. The dollar still has no reason for a sustained medium-term decline—except for Donald Trump. Short positions remain much more attractive, with initial targets at 1.0376 and 1.0315. However, the pair is still in a range-bound market on the daily timeframe, and the technical correction may persist for some time. If you trade purely based on technicals, long positions can be considered if the price is above the moving average, with targets at 1.0559 and 1.0582. However, any growth is still classified as a correction on the daily timeframe.
Explanation of Illustrations:
Linear Regression Channels help determine the current trend. If both channels are aligned, it indicates a strong trend.
Moving Average Line (settings: 20,0, smoothed) defines the short-term trend and guides the trading direction.
Murray Levels act as target levels for movements and corrections.
Volatility Levels (red lines) represent the likely price range for the pair over the next 24 hours based on current volatility readings.
CCI Indicator: If it enters the oversold region (below -250) or overbought region (above +250), it signals an impending trend reversal in the opposite direction.