empty
26.09.2022 12:28 PM
Bitcoin forms a descending triangle pattern: will local bottom be updated?

Bitcoin spent the weekend consolidating within a narrow range. The decline in overall trading activity did not affect the cryptocurrency quotes in any way since the interest of retail investors is at a minimum. Bitcoin starts the new week with the formation of a dangerous bearish pattern near the $18.9k level.

After a powerful market crash on September 13 and the formation of one of the largest bearish candles in recent times, BTC/USD has taken a downward direction. On the daily chart of the cryptocurrency, we see a gradual narrowing of the range of fluctuations, which can have far-reaching consequences.

Is the market preparing to sink to the bottom?

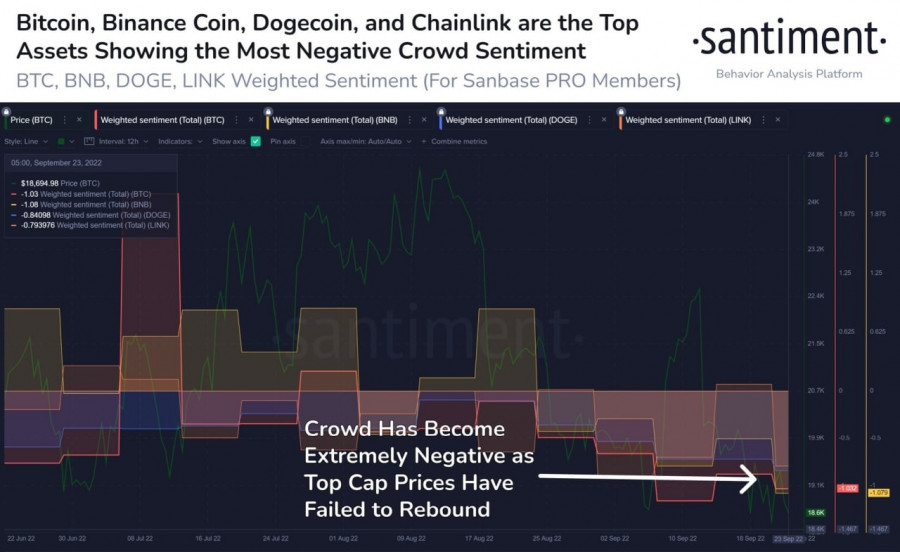
On September 22, buyers formed large volumes and converted them into a green candle. However, it was not possible to develop local success in the future. An unsuccessful attempt to carry out a local rebound exacerbated market sentiment. According to the Santiment report, the cryptocurrency market is experiencing extreme negative sentiment due to failed rebound attempts.

This image is no longer relevant

This leads investors to take concrete action to protect their interests near or below the local low at $17.7k. Each unsuccessful attempt to rebound leads to the saturation of the zone under the local bottom with liquidity. And judging by the price action on the daily chart, the market is gearing up to harvest below $17.7k.

Bitcoin Technical analysis

On the daily chart of BTC/USD, the price is tightening and a descending triangle pattern is forming. The breakdown of this figure will likely be a breakdown of the $17.7k level and an update of the local bottom.

Buying volumes are at their lowest level in the current bear market. Another increase in the key rate is forcing investors to sell their assets in order to avoid margin calls. The result is an ideal situation to update the local bottom and collect large amounts of liquidity below $17.7k.

The formation of a descending triangle may become a prerequisite for a subsequent update of the market bottom. Technical indicators generally show a lull, but, most likely, bearish pressure will resume with the opening of US markets.

Last week, the stochastic oscillator managed to break out of the oversold zone, but subsequently the metric again fell below the 20 level. This is another clear evidence of the weakness of the buyers and the lack of volume needed to protect $17.7k.

S&P 500 Analysis

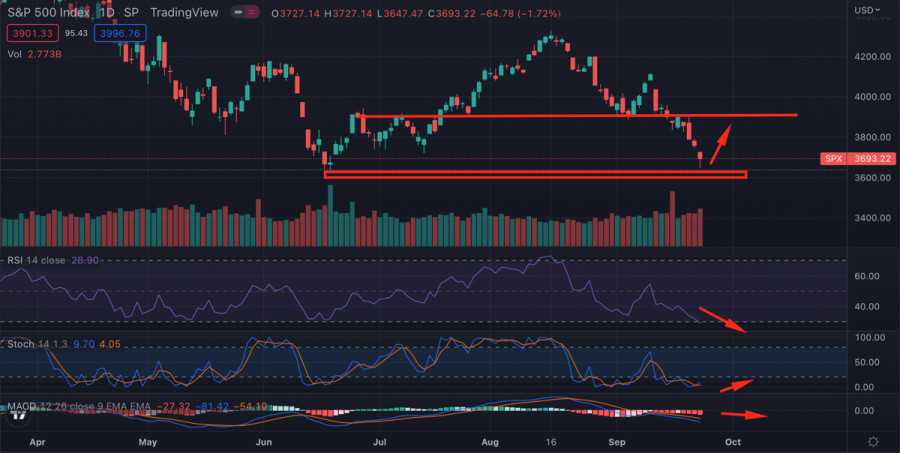
SPX continues to fall and reaches the key support zone at $3,640. Near this level, there are signs of activation of buyers. The bulls managed to move the price away from the important level and as of September 26, the index is trading near $3,700.

This image is no longer relevant

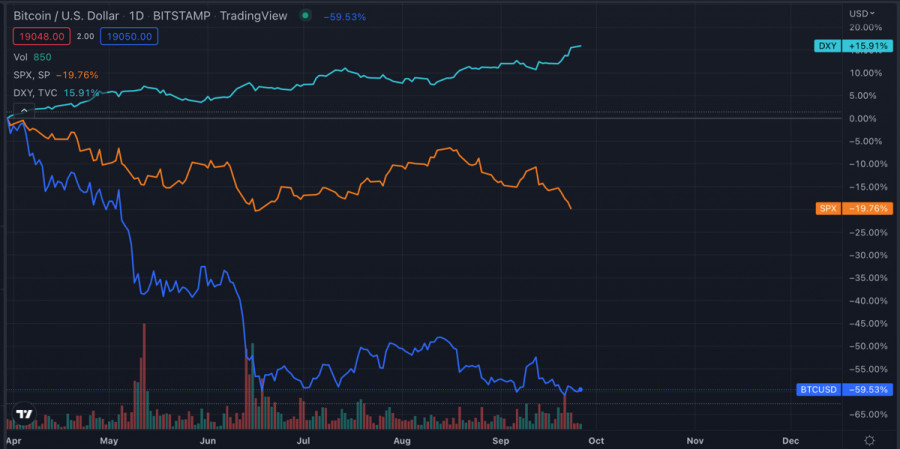
It is important to note that over the past few days, the correlation between Bitcoin and SPX has cracked. The stock index continued to decline while the cryptocurrency stubbornly resisted and remained in a tight range. Judging by the successful rebound of SPX, it will become clear in the near future whether BTC will follow the stock index in an upward movement.

DXY Analysis

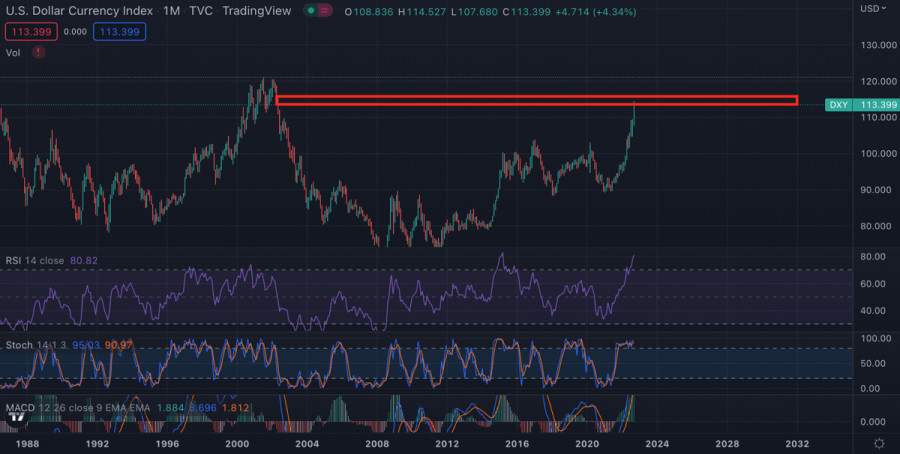
An interesting situation arose with the US dollar index. The asset peaked at 114.5 but subsequently faced increased selling pressure. On the monthly chart, we see that the price has almost reached the high of 2003–2004.

This image is no longer relevant

The technical metrics of the asset on the monthly chart are deep in the overbought zone. It is likely that we will soon face a serious correction in the DXY index, as the asset has reached an absolute peak in all indicators.

Conclusions

There is a high probability that Bitcoin will update the local low in the next two weeks. Technical metrics and another peak moment of negative news have a positive effect on the positions of sellers.

This image is no longer relevant

In the medium term, the markets may be overwhelmed by an upward trend. The impending DXY correction will exceed the drop in the price of the index during the month of the summer. In parallel with the corrective movement of the dollar index, the stock and crypto markets updated local highs. It is likely that we will observe a similar picture in the second half of autumn.

Artem Petrenko,
Analytical expert of InstaForex
© 2007-2025
选择时间框架
5
分钟
15
分钟
30
分钟
1
小时
4
小时
1
1
通过InstaForex赚取加密货币汇率变动的收益。
下载MetaTrader 4并开启您的第一笔交易。
  • Grand Choice
    Contest by
    InstaForex
    InstaForex always strives to help you
    fulfill your biggest dreams.
    JOIN CONTEST

推荐文章

4月25日加密貨幣市場的交易建議

昨天未能保持在94,000美元以上的嘗試顯示出仍有大量的買盤興趣。儘管昨天歐洲時段的調整可能略微動搖了一些人的信心,但以太坊的表現仍相當穩健。

Miroslaw Bawulski 08:56 2025-04-25 UTC+2

2025年4月25日星期五波卡(Polkadot)加密貨幣的日內價格變動技術分析。

儘管隨著隨機震盪指標已經位於超買區(80)以上,目前仍然在WMA(30 Shift 2)上方運行,這表明偏向仍為多頭。然而,根據隨機震盪指標的情況,顯示近期Polkadot有可能出現走弱調整,至4.0733的水平。

Arief Makmur 07:02 2025-04-25 UTC+2

Solana 加密貨幣 2025 年 4 月 25 日(星期五)盤中價格波動的技術分析。

儘管目前Solana加密貨幣處於強勢狀態,其價格在WMA(30 Shift 2)上方運行,但由於Solana價格走勢與隨機震盪指標之間出現背離,同時隨機指標也處於超買水平(80)以上,並正在準備跌至該水平以下,這些跡象表明在不久的將來,它可能會回調至145.25的水平。然而,只要下跌不跌破並收盤低於141.02的水平,Solana仍有可能再次增強,154.50的水平將嘗試向上突破,如果成功,Solana將繼續強勢至156.51的主要目標,如果增強的波動性和動能支持,159.60將成為下一個目標。

Arief Makmur 07:02 2025-04-25 UTC+2

BTC/USD 分析——4月24日:比特幣顯示復甦跡象

在BTC/USD四小時圖上的波浪圖形變得較為複雜。我們觀察到一個調整的下降結構,其形態在75,000美元附近完成。

Chin Zhao 10:15 2025-04-24 UTC+2

4月24日加密貨幣市場的交易建議

比特幣未能保持在94,000美元以上,回調至92,500美元區域,該區域似乎更為穩定。以太坊在短暫突破1,830美元後,也回落至約1,769美元。

Miroslaw Bawulski 08:58 2025-04-24 UTC+2

比特幣可能恢復上升趨勢

比特幣昨日出現強勁上漲。在突破 $90,000 關口後,這一主流加密貨幣漲至 $94,000,其漲勢暫時停滯。

Jakub Novak 12:59 2025-04-23 UTC+2

4月23日加密貨幣市場的交易建議

比特幣成功突破90,000美元,而以太坊在短短一天內上漲超過10%,回升至1,800美元。 主要的催化劑是昨天唐納德·特朗普的一則聲明,他明確表示解除傑羅姆·鮑威爾作為美聯儲主席的職位並不是他的目標。

Miroslaw Bawulski 09:03 2025-04-23 UTC+2

BTC/USD 分析 - 4月22日:關鍵時刻

在BTC/USD的4小時圖上的波浪結構相當清晰。在完成一個由五個完整波浪組成的上升趨勢後,下行段開始形成,目前看似是修正。

Chin Zhao 11:49 2025-04-22 UTC+2

4月22日加密貨幣市場的交易建議

比特幣重回88,000美元區域,但以太坊面臨挑戰 昨天美國交易時段中的拋售潮,再次因美國股票指數下跌引發,比特幣買家進行了抵消,而以太坊在低點附近卻顯得乏人問津。顯然,在關於美國經濟衰退即將到來的討論不斷增加,以及美國聯邦準備理事會主席傑羅姆·鮑威爾面臨繼續降息的壓力之下,對加密貨幣的需求仍然受到抑制。

Miroslaw Bawulski 08:18 2025-04-22 UTC+2

4月21日加密貨幣市場交易建議

比特幣和以太坊在經歷整個周末的橫盤整理後,於今天的亞洲交易時段大幅上漲。 此次上漲是由於謠傳美國聯邦儲備委員會主席Jerome Powell可能被免職的消息引發的——這一事件將進一步加劇目前撼動美國經濟的動盪,導致美元出現強烈的拋售,進一步削弱了投資者對綠幣的信心。

Miroslaw Bawulski 09:03 2025-04-21 UTC+2
现在无法通话?
提出您的问题,用 在线帮助.
Widget callback
 

Dear visitor,

Your IP address shows that you are currently located in the USA. If you are a resident of the United States, you are prohibited from using the services of InstaFintech Group including online trading, online transfers, deposit/withdrawal of funds, etc.

If you think you are seeing this message by mistake and your location is not the US, kindly proceed to the website. Otherwise, you must leave the website in order to comply with government restrictions.

Why does your IP address show your location as the USA?

  • - you are using a VPN provided by a hosting company based in the United States;
  • - your IP does not have proper WHOIS records;
  • - an error occurred in the WHOIS geolocation database.

Please confirm whether you are a US resident or not by clicking the relevant button below. If you choose the wrong option, being a US resident, you will not be able to open an account with InstaForex anyway.

We are sorry for any inconvenience caused by this message.