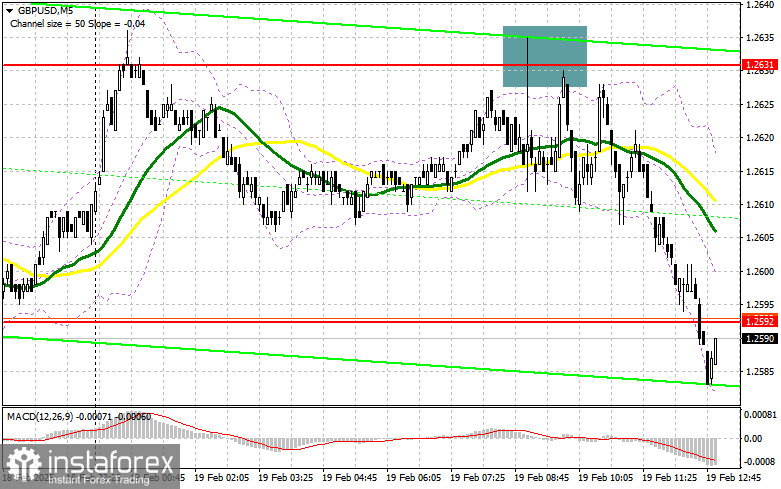
In my morning analysis, I focused on 1.2631 as a key level for making trading decisions. A rise followed by a false breakout at this level provided an ideal scenario for opening short positions, leading to a decline of over 50 points in GBP/USD. Given this movement, the technical outlook has been revised for the second half of the session.
Long Positions on GBP/USD
The report on rising annual inflation in the UK and a slower decline in the monthly reading boosted demand for the pound. However, this was not enough to break above 1.2631. With inflation remaining high, the Bank of England will likely find it more challenging to lower rates, increasing the likelihood of renewed demand for the pound after a correction.
In the second half of the session, U.S. building permits and housing starts data could pressure the pound, but only if the figures exceed market expectations. Additionally, a hawkish FOMC meeting minutes report would support selling GBP/USD in favor of the dollar.
If the pair declines following economic data, buyers will need to defend 1.2584, a level that remains key support. Long positions will only be considered after a false breakout at this level, aiming for a rebound toward 1.2631. A break and retest of 1.2631 from above would confirm a stronger bullish setup, allowing an advance to 1.2664. The ultimate target for long positions will be 1.2692, where profits should be taken.
If the pair moves lower and 1.2584 fails to hold, downward pressure will increase. In that scenario, a false breakout near 1.2550 will provide an entry for long positions. Alternatively, a bounce-buy setup from 1.2515 will be considered, targeting an intraday correction of 30–35 points.
Short Positions on GBP/USD
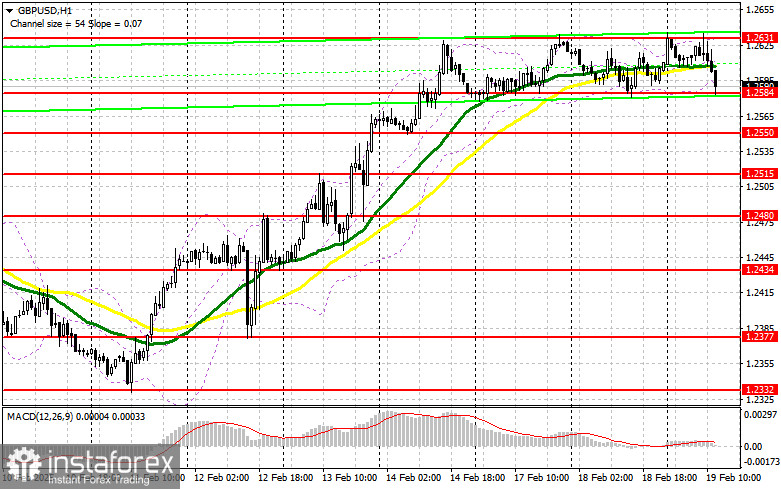
Sellers have successfully defended 1.2631, and the focus now shifts to a potential breakout from the range-bound market seen over the past three days. If the pair rises again, a false breakout at 1.2631, similar to the morning setup, will provide an entry for short positions. The first target will be 1.2584. A break below this level, followed by a retest from below, will confirm further downside, triggering stop-loss orders and opening the path toward 1.2550.
If bearish momentum strengthens, the final target for short positions will be 1.2515, where profits should be taken.
Should demand for the pound increase after the FOMC minutes and economic data, and if bears fail to act at 1.2631, the pair will likely continue its upward movement. In that case, selling should be postponed until a retest of 1.2664, with short positions considered only after an unsuccessful breakout attempt. If bearish confirmation is also absent at this level, the next area to look for short opportunities will be 1.2692, expecting a 30–35 point downward correction.
COT Report (Commitments of Traders)
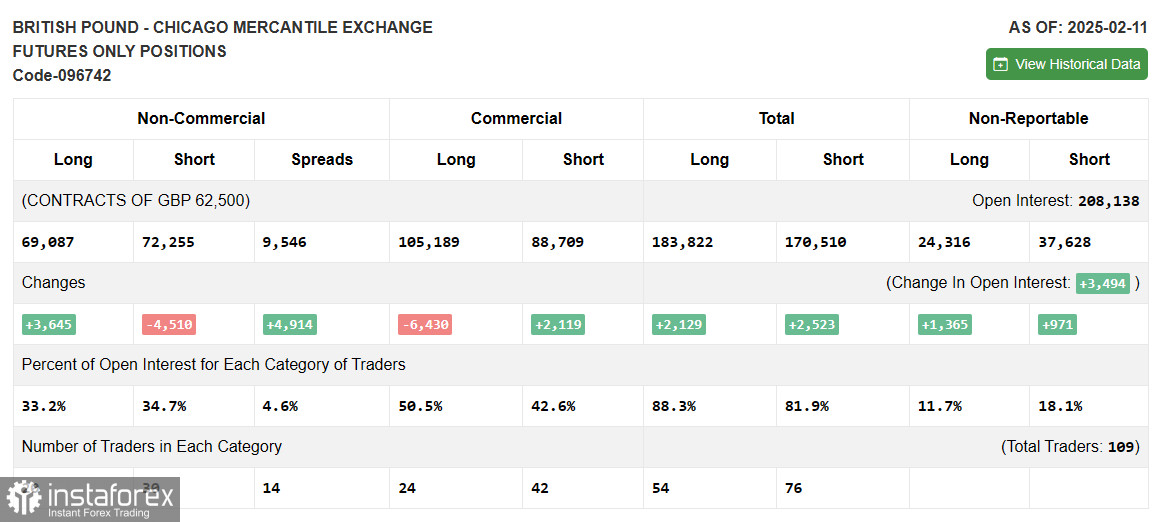
The February 11 COT report showed a reduction in both long and short positions, though demand for the pound increased sharply. However, this report does not reflect the recent phone conversation between Putin and Trump, so it should not be given too much weight. The first meeting between the two leaders likely shifted market sentiment toward GBP buyers, reflected in the increased demand for risk assets.
At present, the U.S. dollar remains weak, especially when compared to the recent fundamental data from the U.S., which continues to show mixed results. The latest COT data indicates that long non-commercial positions rose by 3,645 to 69,087, while short non-commercial positions fell by 4,510 to 72,255, increasing the net gap between long and short positions by 4,914.
Technical Indicators
Moving Averages
GBP/USD is trading near the 30 and 50-period SMAs, indicating market uncertainty in the short term.
Bollinger Bands
If the pair declines, the lower boundary of the indicator around 1.2584 will act as the first support level.
Indicator Descriptions:
- Moving Average (MA): Determines the current trend by smoothing out volatility and noise. Period – 50, marked in yellow on the chart.
- Moving Average (MA): Another moving average for trend analysis. Period – 30, marked in green on the chart.
- MACD (Moving Average Convergence/Divergence):
- Fast EMA – Period 12
- Slow EMA – Period 26
- SMA – Period 9
- Bollinger Bands: Used to measure market volatility. Period – 20.
- Non-commercial traders: Speculators such as individual traders, hedge funds, and large institutions that use the futures market for speculative purposes and meet specific requirements.
- Long non-commercial positions: The total long open positions held by non-commercial traders.
- Short non-commercial positions: The total short open positions held by non-commercial traders.
- Net non-commercial position: The difference between short and long positions held by non-commercial traders.