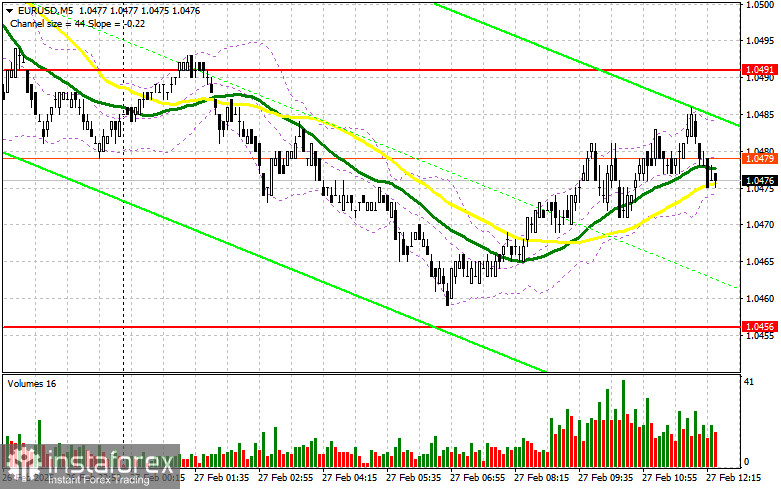
In my morning forecast, I highlighted the 1.0491 level as a key area for market entry decisions. A review of the 5-minute chart shows that although there was an upward movement, the price did not reach this level for a false breakout formation, leaving me without a trade. Once again, volatility remained subdued. No changes have been made to the technical picture for the second half of the day.
Conditions for Opening Long Positions on EUR/USD
The market's lack of reaction to eurozone credit data was expected. Now, attention shifts to a series of important US statistics, with the revised GDP growth figures for Q4 2024 being the most crucial. If the data indicates stronger growth, the US dollar may rise. Conversely, if GDP is revised downward, EUR/USD could rebound towards the middle of the sideways channel. Traders will also focus on initial jobless claims and the core personal consumption expenditures (PCE) index.
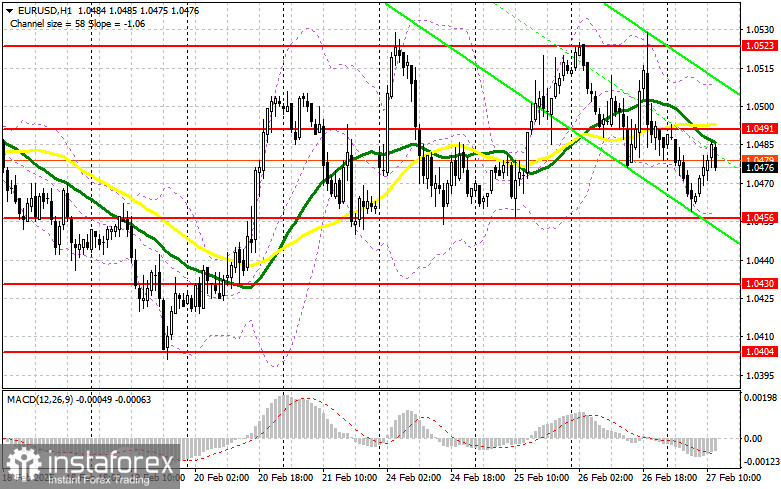
If the euro faces renewed pressure after strong US data, my strategy will be to rely on support at 1.0456, which forms the lower boundary of the range. Only after confirming a false breakout at this level, I will consider a long position, targeting resistance at 1.0491. A breakout and retest of this range from above would validate a buy trade, with a target of 1.0523. The most distant upside level remains 1.0564, where I plan to secure profits.
If EUR/USD declines and lacks bullish activity at 1.0456, which is the more likely scenario, buyers may lose control, allowing sellers to push the price lower toward 1.0430, the new weekly low. Only a false breakout at 1.0430 would justify new buy positions. If the price continues falling, I will consider long entries from 1.0404, targeting a 30-35 point intraday correction.
Conditions for Opening Short Positions on EUR/USD
Sellers failed to gain traction due to the lack of significant UK data, leaving the pair short of reaching the nearest resistance. If EUR/USD rises in the second half of the day following weak US GDP figures, the focus will be on defending resistance at 1.0491, where the moving averages favor the bears. A false breakout at this level would provide a sell signal, targeting support at 1.0456. A break below this area, followed by a retest from below, would confirm an additional short position, driving the pair toward the 1.0430 low, effectively negating the euro's upward potential.
The final downward target is 1.0404, where I plan to secure profits. If EUR/USD rises in the second half of the day and sellers fail to assert themselves around 1.0491, the bulls could extend the rally. In this case, I will delay short positions until 1.0523, where I will only sell after a failed breakout attempt. If the price does not react at 1.0523, I will consider selling from 1.0564, aiming for a 30-35 point downward correction.
Commitments of Traders (COT) Report
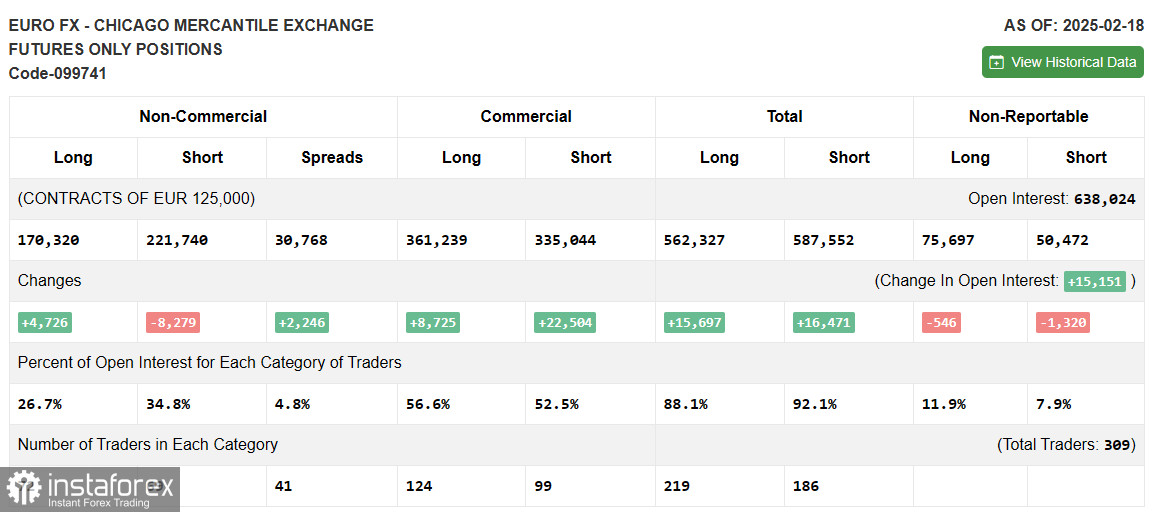
The COT report from February 18 indicated an increase in long positions and a sharp reduction in short positions. More traders were buying the euro, partly due to Russia-US negotiations regarding the Ukraine conflict. The prospect of reduced military action in the coming months has boosted demand for risk assets, supporting the euro. However, the overall market bias remains bearish, so traders should be cautious with euro purchases at highs.
According to the COT report, long speculative positions increased by 4,726, reaching 170,320, while short positions dropped by 8,279 to 221,740, widening the long-to-short gap by 2,246.
Indicator Signals
The moving averages suggest market uncertainty, as trading is occurring near the 30 and 50-day moving averages.
The Bollinger Bands indicate that the lower boundary at 1.0456 will act as support in case of further declines.
Indicator Breakdown
- Moving Averages (MA50 and MA30) smooth market noise and define current trends. The 50-period moving average is marked in yellow, and the 30-period moving average in green.
- MACD (Moving Average Convergence/Divergence) tracks trend strength and momentum, with EMA 12, EMA 26, and SMA 9 as its key settings.
- Bollinger Bands (BB, period 20) provide volatility insights and key price levels.
- Non-commercial traders include speculators, hedge funds, and institutions that trade futures for speculative purposes.
- Long non-commercial positions represent the total open long positions held by speculators.
- Short non-commercial positions represent the total open short positions held by speculators.
- The net non-commercial position is the difference between long and short speculative contracts.