empty
 
 
17.02.2025 10:13 AM
The Market on the Verge of Overheating: What Could Trigger a Correction?

This image is no longer relevant

The U.S. stock market continues its upward movement; however, indices are approaching key levels that could lead to profit-taking. The week ended in uncertainty: the S&P 500 closed unchanged, the Nasdaq gained 0.4%, while the Dow Jones lost 165 points.

The primary driver of increased volatility was weak retail sales, which fell 0.9% in January, marking the sharpest decline in a year.

This has raised concerns about consumer spending, which remains a key driver of U.S. economic growth.

Despite this, the market remained generally stable as investors digested recent political developments, including Trump's new tariff plans and attempts at diplomatic resolution of the Ukraine crisis.

Wall Street responded positively to the delay of reciprocal tariffs, which allowed indices to post solid weekly gains: S&P 500 rose by 1%, Dow Jones gained 0.3%, and Nasdaq surged by 1.7%.

Tech Sector Leads the Market

The technology sector continues to outperform:

  • Airbnb shares rose 14.4% on a strong earnings report.
  • GameStop shares gained 2.6%, driven by new Bitcoin speculation.
  • Moderna, despite a larger-than-expected loss, saw its stock rise 3.3%.
  • In contrast, Eli Lilly shares dropped 3%, reflecting investor disappointment.

The Week Ahead: Cautious Optimism and Focus on the Federal Reserve

The new week begins with cautious optimism, but the market remains in a wait-and-see mode. The focus is on the release of the FOMC meeting minutes, which could provide hints about the Fed's future policy stance.

Additionally, several Fed officials are scheduled to speak, potentially clarifying the outlook for interest rates.

Key Economic Data to Watch:

  • U.S. housing market reports: including building permits, housing starts, and existing home sales, will be closely monitored. These figures will provide insights into the state of the construction sector, which is highly sensitive to interest rate changes.
  • PMI Index from S&P Global: This will indicate whether growth momentum in manufacturing and services remains intact.
  • If PMI data is strong, it could reinforce the Fed's stance on keeping rates high, which may pressure the stock market.

S&P 500: Bullish Momentum Persists

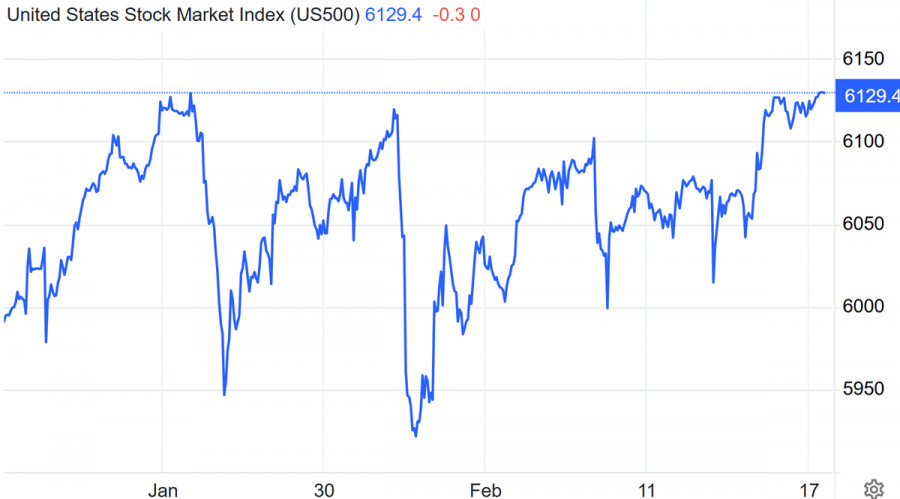
The S&P 500 has held above the critical 6,100 level, confirming the resilience of the current uptrend. If the index remains above 6,120, it could move toward 6,150, where profit-taking may begin.

A breakout above 6,150 would set up a new target at 6,180 – 6,200, potentially reaching a new all-time high.

Key support is now at 6,100, and a break below this level could trigger a pullback to 6,080 and 6,050. If a bearish scenario unfolds, the critical support zone lies near 6,000, where the 50-day SMA is positioned.

This image is no longer relevant

Indicators:

  • RSI (14) = 62, indicating the index is approaching overbought conditions, but no reversal signals yet.
  • MACD remains in bullish territory, confirming a positive market sentiment.
  • 50-day SMA near 6,000, acting as a key dynamic support.

If the S&P 500 holds above 6,120, further gains toward 6,150 and beyond are possible. However, a drop below 6,100 could signal a correction toward 6,080 – 6,050.

Nasdaq 100: Testing 22,200

The Nasdaq 100 continues to rally, reinforcing the strength of the tech sector. Key resistance is at 22,200, and a breakout would open the door to 22,500, marking a new record high. However, signs of overbought conditions suggest a potential pullback, particularly if investors begin to lock in profits.

Support Levels:

  • 22,000: A break below this level could lead to a pullback toward 21,800.
  • 21,600: A deeper correction could test this level, where the 50-day SMA is located.

Indicators:

  • RSI (14) = 70, indicating overbought conditions, increasing the likelihood of a correction.
  • MACD remains in bullish territory but signals a possible slowdown in momentum.
  • 50-day SMA at 21,600, acting as a key support level in case of a correction.

The overbought condition increases the risk of a short-term correction. If the Nasdaq 100 holds above 22,200, further gains toward 22,500 are possible. However, a drop below 22,000 could trigger a decline toward 21,800 – 21,600.

Natalya Andreeva,
انسٹافاریکس کا تجزیاتی ماہر
© 2007-2025
انسٹافاریکس کے ساتھ کرپٹو کرنسی کی معاملاتی تبدیلیوں سے کمائیں۔
میٹا ٹریڈر 4 ڈاؤن لوڈ کریں اور اپنی پہلی ٹریڈ کھولیں۔
  • Grand Choice
    Contest by
    InstaForex
    InstaForex always strives to help you
    fulfill your biggest dreams.
    مقابلہ میں شامل ہوں
  • چانسی ڈیپازٹ
    اپنے اکاؤنٹ میں 3000 ڈالر جمع کروائیں اور حاصل کریں$1000 مزید!
    ہم فروری قرعہ اندازی کرتے ہیں $1000چانسی ڈیپازٹ نامی مقابلہ کے تحت
    اپنے اکاؤنٹ میں 3000 ڈالر جمع کروانے پر موقع حاصل کریں - اس شرط پر پورا اُترتے ہوئے اس مقابلہ میں شرکت کریں
    مقابلہ میں شامل ہوں
  • ٹریڈ وائز، ون ڈیوائس
    کم از کم 500 ڈالر کے ساتھ اپنے اکاؤنٹ کو ٹاپ اپ کریں، مقابلے کے لیے سائن اپ کریں، اور موبائل ڈیوائسز جیتنے کا موقع حاصل کریں۔
    مقابلہ میں شامل ہوں
  • 100 فیصد بونس
    اپنے ڈپازٹ پر 100 فیصد بونس حاصل کرنے کا آپ کا منفرد موقع
    بونس حاصل کریں
  • 55 فیصد بونس
    اپنے ہر ڈپازٹ پر 55 فیصد بونس کے لیے درخواست دیں
    بونس حاصل کریں
  • 30 فیصد بونس
    ہر بار جب آپ اپنا اکاؤنٹ ٹاپ اپ کریں تو 30 فیصد بونس حاصل کریں
    بونس حاصل کریں

تجویز کردہ مضامین

ابھی فوری بات نہیں کرسکتے ؟
اپنا سوال پوچھیں بذریعہ چیٹ.
Widget callback