empty
 
 
21.02.2025 01:00 PM
GBP/USD. February 21st. The British Pound Receives Its First Positive Signal

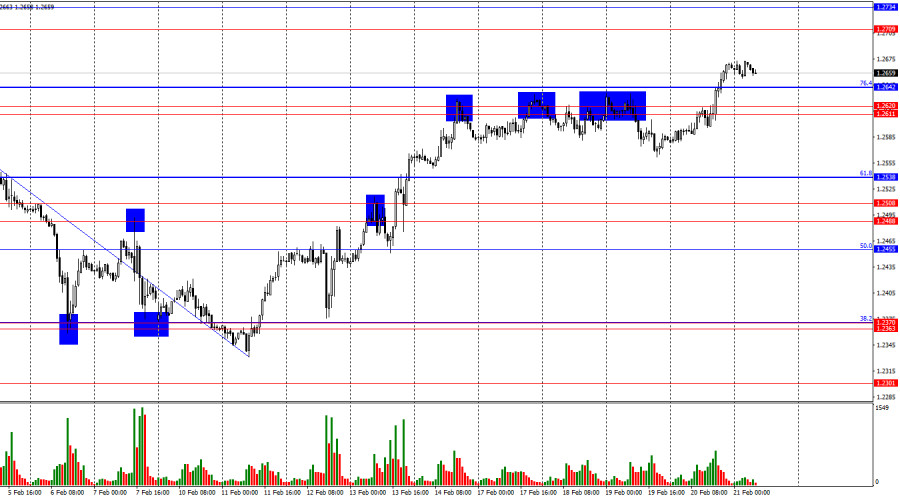
On the hourly chart, the GBP/USD pair secured itself above the resistance zone of 1.2611–1.2642 on Thursday, allowing for expectations of further growth towards the next resistance area at 1.2709–1.2734. A rebound from this zone could halt the bulls' advance.

This image is no longer relevant

The wave situation remains clear. The last completed downward wave did not break below the previous low, while the last upward wave surpassed the prior peak. Thus, the formation of a bullish trend appears to be ongoing. However, recent waves differ significantly in size and present multiple possible structures. I am not fully convinced that we are in a sustained bullish trend, but at the same time, the strong rally in the pound in recent weeks cannot be ignored.

Thursday's fundamental backdrop offered no particular support for the pound, as no major economic reports were released. However, earlier in the week, the UK saw a strong inflation report, a decent unemployment report, and solid wage growth figures. Bulls had the opportunity to push the pair higher on Tuesday and Wednesday but only managed to break through the 1.2611–1.2620 zone on Thursday.

Today, the first new support factors for the pound have emerged. The UK retail sales report released in the morning showed a 1.7% m/m increase and a 1.0% y/y rise, significantly surpassing expectations. Later in the day, the PMI indices for the manufacturing and services sectors, along with the composite index, will be released. In the second half of the day, the U.S. will publish similar PMI data, supplemented by two additional reports on new home sales and consumer sentiment. If the upcoming reports match or exceed expectations, the pound may continue to rise into Friday.

Overall, this week has been highly favorable for pound bulls, while the U.S. economic backdrop remains relatively weak, failing to support bearish traders.

This image is no longer relevant

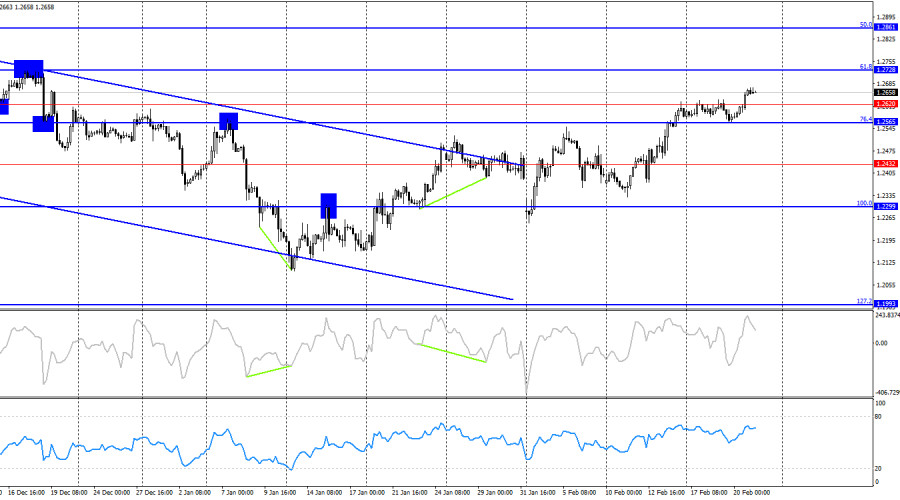
On the 4-hour chart, the pair continues to rise and has firmly established itself above the 1.2565–1.2620 resistance zone. If bullish traders persist in their advance, even without fundamental support, the pound could climb to any level. The next upside target is the 61.8% Fibonacci retracement level at 1.2728. No developing divergences are currently visible on any indicators.

Commitments of Traders (COT) Report

This image is no longer relevant

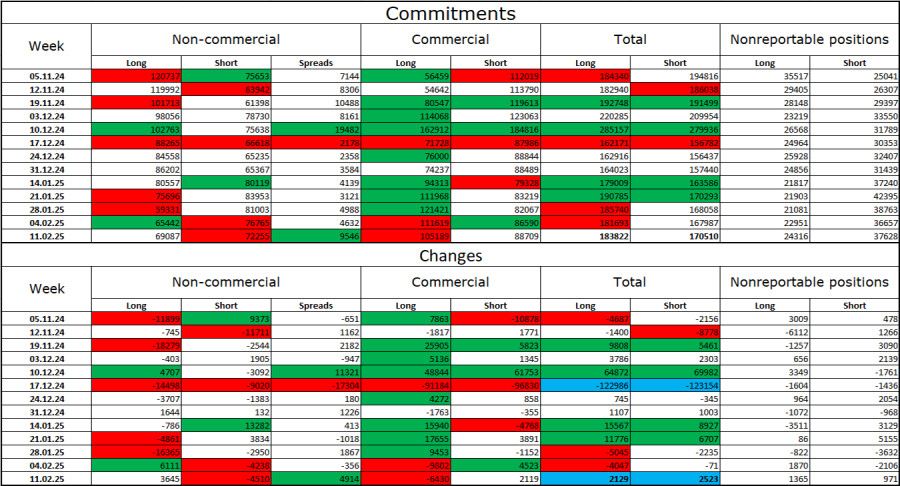
The latest COT report for the "Non-commercial" category of traders indicates a less bearish sentiment. The number of long positions increased by 3,645, while short positions decreased by 4,510. Although bulls have lost their earlier dominance in the market, bears have yet to strengthen their grip. The spread between long and short positions remains in favor of bears: 69,000 vs. 72,000.

I still believe the GBP has downward potential, as COT data suggests a slow but steady increase in bearish positions. Over the past three months, long contracts have dropped from 120,000 to 69,000, while short positions have remained stable, decreasing slightly from 75,000 to 72,000. As market conditions evolve, institutional players will likely continue reducing their long positions or increasing their short exposure, as most bullish factors for the pound have already been priced in.

Economic Calendar for the UK and U.S.

UK Data Releases:

  • Retail Sales Change (07:00 UTC)
  • Services PMI (09:30 UTC)
  • Manufacturing PMI (09:30 UTC)

U.S. Data Releases:

  • Services PMI (14:45 UTC)
  • Manufacturing PMI (14:45 UTC)
  • New Home Sales (15:00 UTC)
  • University of Michigan Consumer Sentiment Index (15:00 UTC)

Friday's economic calendar is packed with data releases of similar significance, meaning the impact of fundamental events on market sentiment will likely be moderate.

Trading Outlook for GBP/USD

Short positions may be considered if the pair rebounds from 1.2709 on the hourly chart, targeting 1.2642.

Long positions were previously viable upon a breakout above 1.2363–1.2370, with targets at 1.2488–1.2508, which have already been achieved. For now, new long entries should be approached with caution, though bulls remain in control.

Fibonacci Levels Used:

  • Hourly Chart: 1.2809–1.2100
  • 4-Hour Chart: 1.2299–1.3432
Samir Klishi,
انسٹافاریکس کا تجزیاتی ماہر
© 2007-2025
انسٹافاریکس کے ساتھ کرپٹو کرنسی کی معاملاتی تبدیلیوں سے کمائیں۔
میٹا ٹریڈر 4 ڈاؤن لوڈ کریں اور اپنی پہلی ٹریڈ کھولیں۔
  • Grand Choice
    Contest by
    InstaForex
    InstaForex always strives to help you
    fulfill your biggest dreams.
    مقابلہ میں شامل ہوں
  • چانسی ڈیپازٹ
    اپنے اکاؤنٹ میں 3000 ڈالر جمع کروائیں اور حاصل کریں$1000 مزید!
    ہم فروری قرعہ اندازی کرتے ہیں $1000چانسی ڈیپازٹ نامی مقابلہ کے تحت
    اپنے اکاؤنٹ میں 3000 ڈالر جمع کروانے پر موقع حاصل کریں - اس شرط پر پورا اُترتے ہوئے اس مقابلہ میں شرکت کریں
    مقابلہ میں شامل ہوں
  • ٹریڈ وائز، ون ڈیوائس
    کم از کم 500 ڈالر کے ساتھ اپنے اکاؤنٹ کو ٹاپ اپ کریں، مقابلے کے لیے سائن اپ کریں، اور موبائل ڈیوائسز جیتنے کا موقع حاصل کریں۔
    مقابلہ میں شامل ہوں
  • 100 فیصد بونس
    اپنے ڈپازٹ پر 100 فیصد بونس حاصل کرنے کا آپ کا منفرد موقع
    بونس حاصل کریں
  • 55 فیصد بونس
    اپنے ہر ڈپازٹ پر 55 فیصد بونس کے لیے درخواست دیں
    بونس حاصل کریں
  • 30 فیصد بونس
    ہر بار جب آپ اپنا اکاؤنٹ ٹاپ اپ کریں تو 30 فیصد بونس حاصل کریں
    بونس حاصل کریں

تجویز کردہ مضامین

ابھی فوری بات نہیں کرسکتے ؟
اپنا سوال پوچھیں بذریعہ چیٹ.
Widget callback