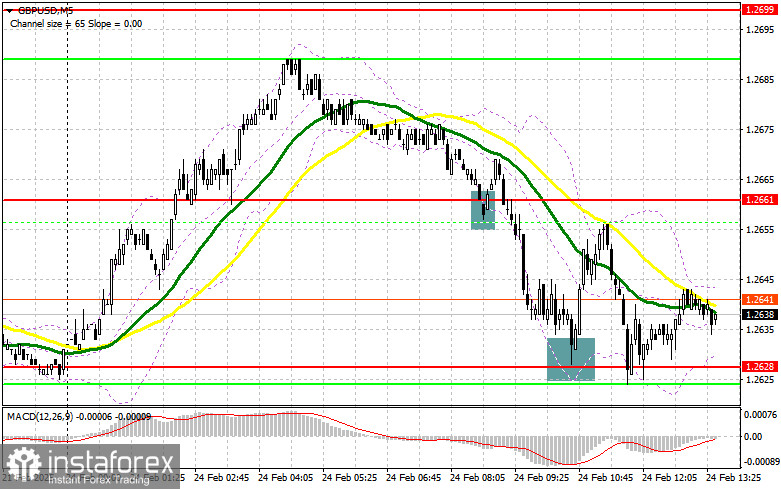
In my morning forecast, I focused on the 1.2628 level as a key decision point for market entry. Looking at the 5-minute chart, we can see that a false breakout at the 1.2628 support level provided a good long entry, leading to a 30-point rise and offsetting losses from buying at 1.2661. The technical picture has been reassessed for the second half of the day.
For Opening Long Positions on GBP/USD:
The pound declined sharply, but buyers remained active, as confirmed by repeated defense of the 1.2628 level. Given the absence of U.S. economic data in the second half of the day, GBP/USD is more likely to resume its uptrend rather than continue correcting lower.
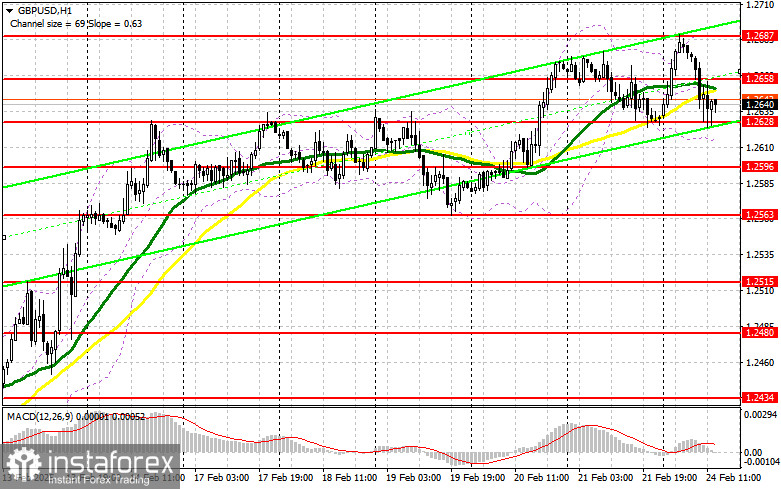
If sellers attempt another decline, I will consider long positions only after another false breakout around 1.2628. The upward target will be 1.2658, which formed as resistance during the European session. A break and retest of this range from above would confirm a buying opportunity, pushing GBP/USD toward 1.2687, the new weekly high. The furthest upward target is 1.2726, where I will take profit.
If GBP/USD falls further and there is no buyer activity at 1.2628, it will not be a disaster for bulls, but pressure on the pound will increase at the start of the week. In this scenario, I will consider long positions only after a false breakout at the 1.2596 low. Otherwise, I will wait for a rebound from 1.2563 to initiate a 30-35 point intraday correction.
For Opening Short Positions on GBP/USD:
Buyers quickly ran out of momentum, leading to a significant correction in the pound. However, there is no strong selling pressure from major players at current levels.
For those betting on further declines, it is best to act from higher levels. A false breakout at the new 1.2658 resistance will create a short entry point, targeting a decline to 1.2628. A break and retest of this level from below would reinforce the bearish outlook, pushing GBP/USD down to 1.2596. The final downward target is 1.2563, where I will take profit.
If demand for the pound returns in the second half of the day and sellers fail to defend 1.2658, where moving averages favor bears, the pair will resume its upward trend. In this case, I will delay short positions until a test of 1.2687. If price struggles to hold above this level, I will sell on a failed breakout. Otherwise, I will wait for a rebound from 1.2726 to execute a 30-35 point downward correction.
COT Report Analysis (Commitment of Traders):
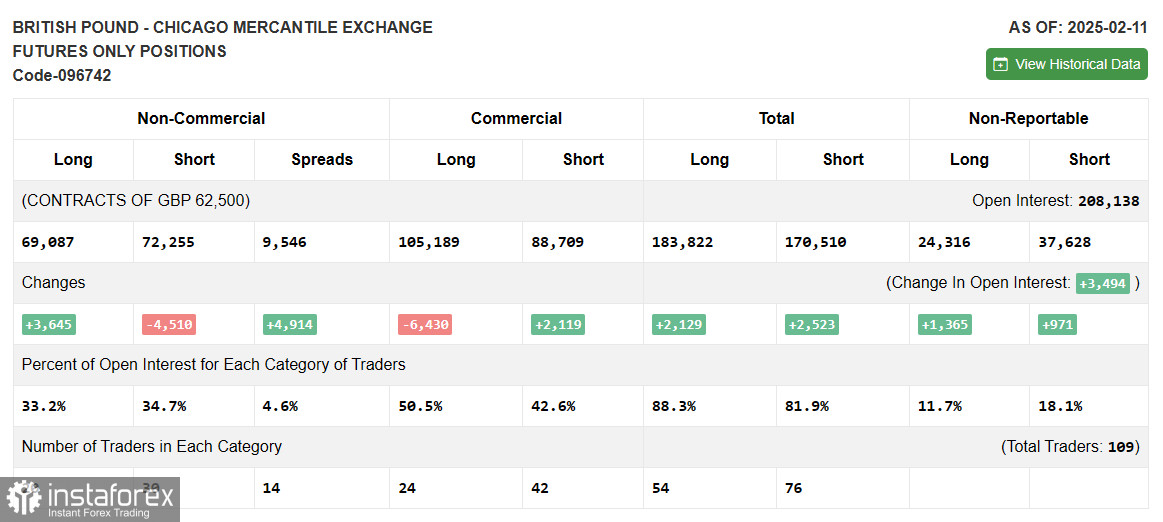
The February 11 COT report showed a decline in both long and short positions, but there was a sharp increase in demand for the pound. However, this report does not reflect the phone conversation between Putin and Trump, so it should not be overanalyzed.
Most likely, after their first meeting, market conditions shifted in favor of buyers, as reflected in the increased demand for risk assets. Currently, the U.S. dollar remains weak, particularly when compared to lackluster fundamental data from the U.S. in recent weeks.
According to the COT report, long non-commercial positions rose by 3,645, reaching 69,087, while short non-commercial positions declined by 4,510, reaching 72,255. As a result, the gap between long and short positions increased by 4,914.
Indicator Signals
Moving Averages
GBP/USD is trading below the 30 and 50-period moving averages, indicating selling pressure.
Note: The moving averages are assessed on the H1 chart, which may differ from classic definitions used for daily moving averages on the D1 chart.
Bollinger Bands
If the pair declines, the lower Bollinger Band at 1.2620 will act as support.
Indicator Explanations:
- Moving Averages (MA) – Identify current trends by smoothing volatility and market noise.
- 50-period MA (Yellow line on the chart).
- 30-period MA (Green line on the chart).
- MACD (Moving Average Convergence/Divergence) – Identifies trend strength and reversals.
- Fast EMA – 12-period
- Slow EMA – 26-period
- SMA – 9-period
- Bollinger Bands – Helps identify support, resistance, and volatility levels.
- 20-period Bollinger Bands used.
- Non-commercial traders – Speculators such as individual traders, hedge funds, and institutions, who trade futures for speculation.
- Long non-commercial positions – Total long positions held by speculators.
- Short non-commercial positions – Total short positions held by speculators.
- Net non-commercial position – The difference between long and short positions of non-commercial traders.