The EUR/USD currency pair showed interesting movements on Monday, giving the technical picture a fresh look. Over the weekend, it seemed like we were in for a "boring Monday," but in practice, it turned out to be anything but dull. As soon as the market opened, the euro began to rise again. In recent weeks, the euro has strengthened its position but failed to break above the last two highs and hold its ground. This movement is visible in the daily time frame—it's a typical flat trend, but it is just in a higher time frame. Therefore, on the 4-hour chart, the pair's movements appear significant and serious, but they remain in a flat range.
Returning to Monday's developments, the euro's new growth can be linked to just one event—the German elections held on Sunday. No single party won the majority of votes. The leading party secured around 30%, meaning that to form a "ruling majority," a coalition of two or even three parties will be necessary. It is difficult to say what is optimistic about this news. The German government will change, and Olaf Scholz will step down, but how will this affect Germany's stagnating economy soon? Of course, changes will happen over time, but how long will they be reflected in macroeconomic indicators?
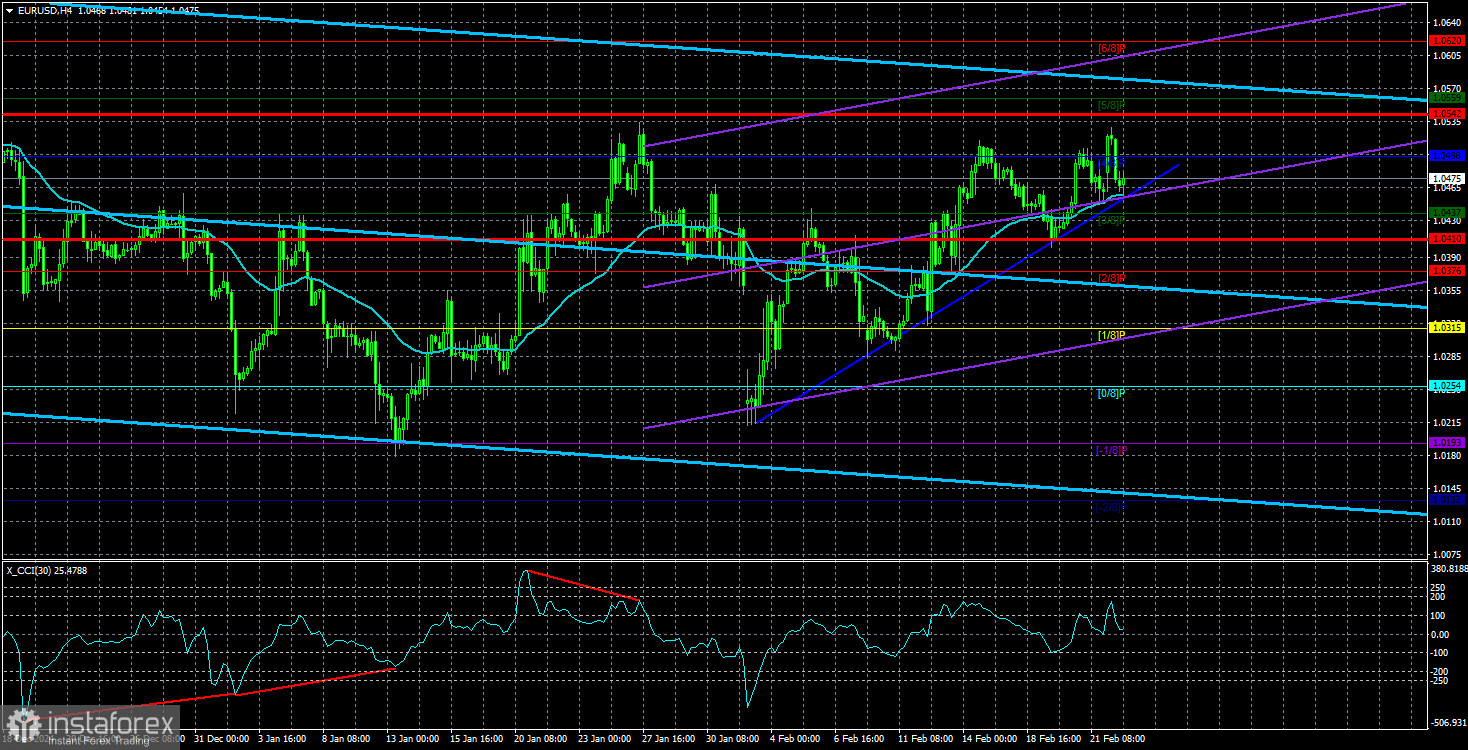
As usual, the market reacted to rumors, expectations, and emotions. By the start of the U.S. trading session, the price had returned to Friday's closing levels, meaning nothing had changed. However, the euro's last surge was quite sharp, so we have drawn a trend line on the 4-hour chart. We believe this line will be broken this week, signaling the beginning of a new downward phase. Over the past month or two, while the EUR/USD pair has been correcting, there have been no significant fundamental changes. Donald Trump has been making threats against half the world but then shifted his focus to Ukraine, demanding that Kyiv "return everything that was earned through hard labor."
Overall, as before, Trump continues to release an enormous amount of information, 80% of which he will likely forget by the next day. The U.S. wants to broker peace between Russia and Ukraine, but neither Moscow nor Kyiv has made any encouraging statements about being ready to cease fire and start direct negotiations. Therefore, nothing has changed except for introducing tariffs on Chinese imports and China's immediate retaliatory tariffs. But this was already familiar from Trump's first term. The euro still has no real fundamental basis for continued growth. A technical correction may last another few months, but that does not change the bigger picture.
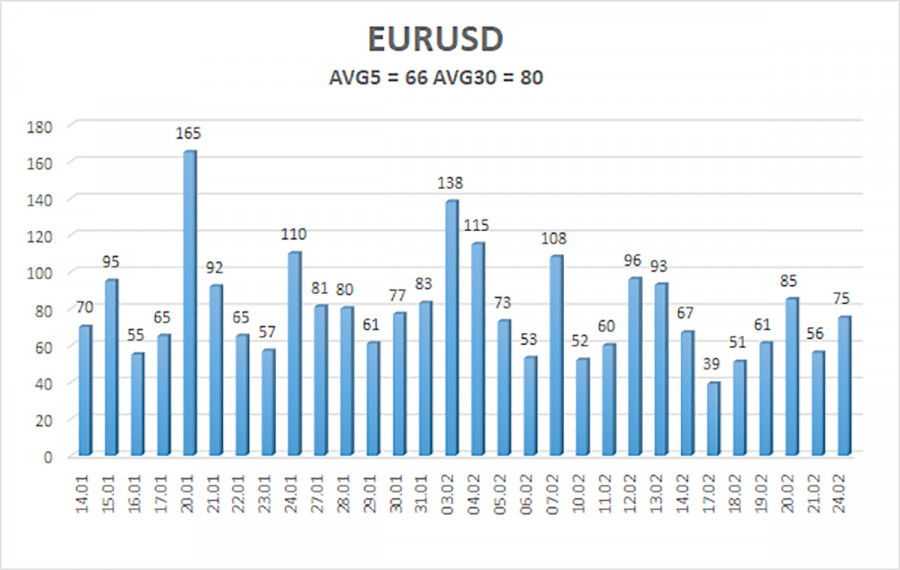
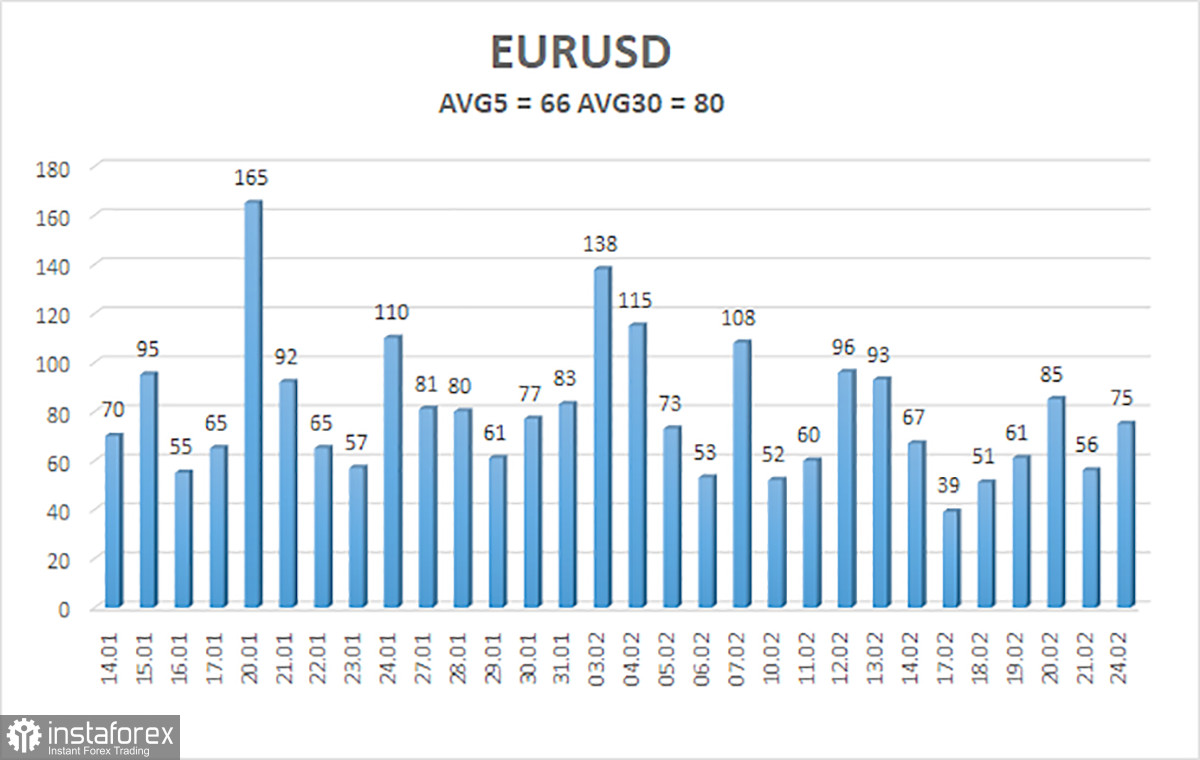
The average volatility of the EUR/USD currency pair over the last five trading days, as of February 25, is 66 pips, which is classified as "average." We expect the pair to move between the levels of 1.0410 and 1.0542 on Tuesday. The long-term regression channel remains downward, indicating that the global downtrend remains intact. The CCI indicator recently entered the oversold zone, leading to a new upward movement from the bottom.
Nearest Support Levels:
S1 – 1.0437
S2 – 1.0376
S3 – 1.0315
Nearest Resistance Levels:
R1 – 1.0498
R2 – 1.0559
R3 – 1.0620
Trading Recommendations:
The EUR/USD pair continues its upward correction. For months, we have been saying that we expect only a decline from the euro in the medium term, and at this point, nothing has changed. The dollar still has no reason for a medium-term decline, except for Donald Trump. Short positions remain much more attractive, with initial targets at 1.0376 and 1.0315. However, the pair is in a flat range, and the technical correction may continue. If you trade based purely on technical analysis, long positions can be considered if the price is above the moving average, with targets at 1.0498 and 1.0542. However, any growth is still classified as a correction on the daily time frame.
Explanation of Illustrations:
Linear Regression Channels help determine the current trend. If both channels are aligned, it indicates a strong trend.
Moving Average Line (settings: 20,0, smoothed) defines the short-term trend and guides the trading direction.
Murray Levels act as target levels for movements and corrections.
Volatility Levels (red lines) represent the likely price range for the pair over the next 24 hours based on current volatility readings.
CCI Indicator: If it enters the oversold region (below -250) or overbought region (above +250), it signals an impending trend reversal in the opposite direction.