signal strength 1 of 5

The Bullish Flag pattern has been formed on the chart AUDCHF M5 which signals that the upward trend will continue. Signals: а break of the peak at 0.5551 may push the price higher, and the rise will be the projection of the pole.
The M5 and M15 time frames may have more false entry points.
See Also
- All
- Double Top
- Flag
- Head and Shoulders
- Pennant
- Rectangle
- Triangle
- Triple top
- All
- #AAPL
- #AMZN
- #Bitcoin
- #EBAY
- #FB
- #GOOG
- #INTC
- #KO
- #MA
- #MCD
- #MSFT
- #NTDOY
- #PEP
- #TSLA
- #TWTR
- AUDCAD
- AUDCHF
- AUDJPY
- AUDUSD
- EURCAD
- EURCHF
- EURGBP
- EURJPY
- EURNZD
- EURRUB
- EURUSD
- GBPAUD
- GBPCHF
- GBPJPY
- GBPUSD
- GOLD
- NZDCAD
- NZDCHF
- NZDJPY
- NZDUSD
- SILVER
- USDCAD
- USDCHF
- USDJPY
- USDRUB
- All
- M5
- M15
- M30
- H1
- D1
- All
- Buy
- Sale
- All
- 1
- 2
- 3
- 4
- 5
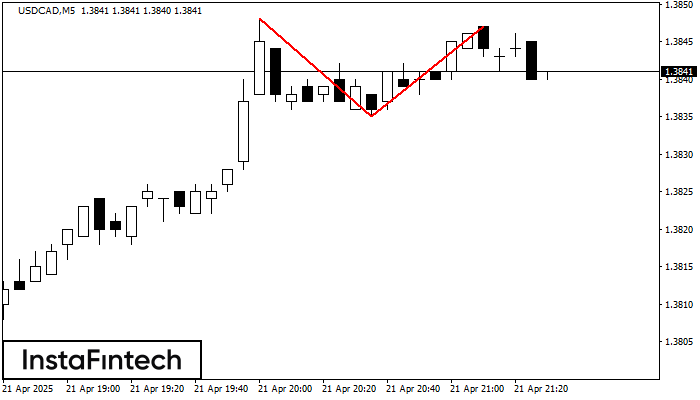
The Double Top pattern has been formed on USDCAD M5. It signals that the trend has been changed from upwards to downwards. Probably, if the base of the pattern 1.3835
The M5 and M15 time frames may have more false entry points.
Open chart in a new window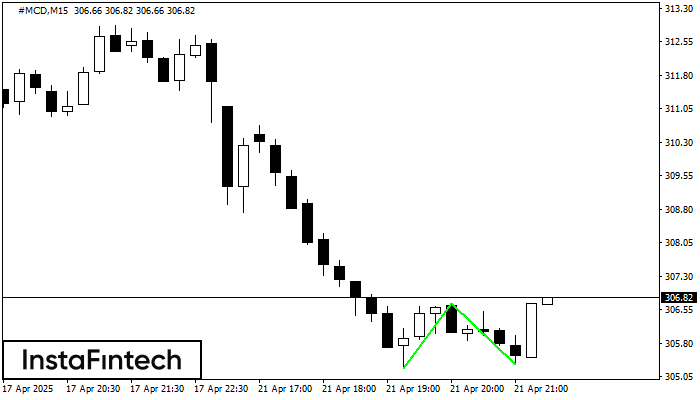
The Double Bottom pattern has been formed on #MCD M15. Characteristics: the support level 305.24; the resistance level 306.70; the width of the pattern 146 points. If the resistance level
The M5 and M15 time frames may have more false entry points.
Open chart in a new window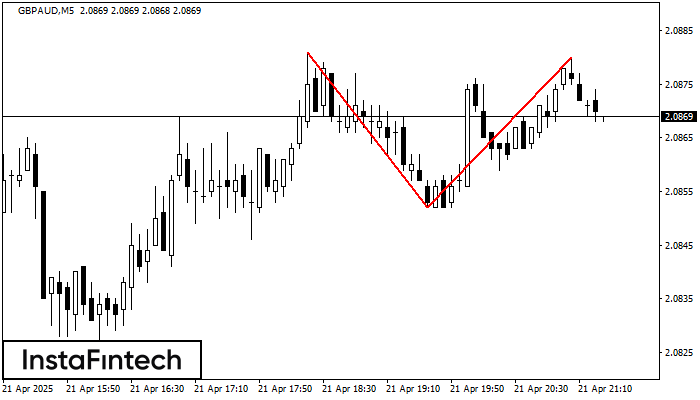
On the chart of GBPAUD M5 the Double Top reversal pattern has been formed. Characteristics: the upper boundary 2.0880; the lower boundary 2.0852; the width of the pattern 28 points
The M5 and M15 time frames may have more false entry points.
Open chart in a new window