signal strength 1 of 5

The Triple Bottom pattern has been formed on #Bitcoin M5. It has the following characteristics: resistance level 83143.83/82884.57; support level 82680.13/82625.22; the width is 46370 points. In the event of a breakdown of the resistance level of 83143.83, the price is likely to continue an upward movement at least to 82669.54.
The M5 and M15 time frames may have more false entry points.
ดูเพิ่มเติม
- All
- Double Top
- Flag
- Head and Shoulders
- Pennant
- Rectangle
- Triangle
- Triple top
- All
- #AAPL
- #AMZN
- #Bitcoin
- #EBAY
- #FB
- #GOOG
- #INTC
- #KO
- #MA
- #MCD
- #MSFT
- #NTDOY
- #PEP
- #TSLA
- #TWTR
- AUDCAD
- AUDCHF
- AUDJPY
- AUDUSD
- EURCAD
- EURCHF
- EURGBP
- EURJPY
- EURNZD
- EURRUB
- EURUSD
- GBPAUD
- GBPCHF
- GBPJPY
- GBPUSD
- GOLD
- NZDCAD
- NZDCHF
- NZDJPY
- NZDUSD
- SILVER
- USDCAD
- USDCHF
- USDJPY
- USDRUB
- All
- M5
- M15
- M30
- H1
- D1
- All
- Buy
- Sale
- All
- 1
- 2
- 3
- 4
- 5
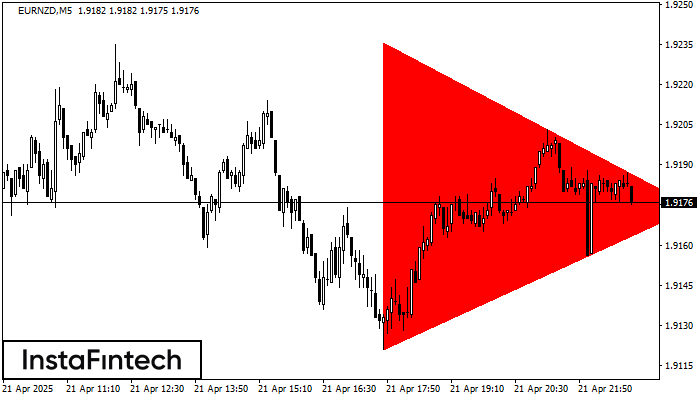
According to the chart of M5, EURNZD formed the Bearish Symmetrical Triangle pattern. Description: The lower border is 1.9121/1.9174 and upper border is 1.9236/1.9174. The pattern width is measured
The M5 and M15 time frames may have more false entry points.
Open chart in a new window
According to the chart of M15, #FB formed the Inverse Head and Shoulder pattern. The Head’s top is set at 485.03 while the median line of the Neck is found
The M5 and M15 time frames may have more false entry points.
Open chart in a new window
The Bearish pennant pattern has formed on the #FB H1 chart. This pattern type is characterized by a slight slowdown after which the price will move in the direction
Open chart in a new window